Admin Panels and Reporting
We build panels where you can manage your customer, order and operations data from a single screen.
What we offer
- Role-based permissions
- Real-time reporting screens
- Data export
What are admin panels for?
Admin panels are web-based interfaces that bring your business’s customer, order and operations data onto a single screen and let your team do their work with that data during the day. Having to check three separate programs to see what stage an order is at, asking someone for a spreadsheet to learn the day’s sales, or finding the same customer under different names in different files are typical signs that you need a panel.
The work we describe on this page is not adding a few charts to a ready-made theme. It means working out where your data comes from, who needs to see what and which decisions rest on which numbers, and building an admin panel software around that.
Operations screen and reporting panel: two different needs
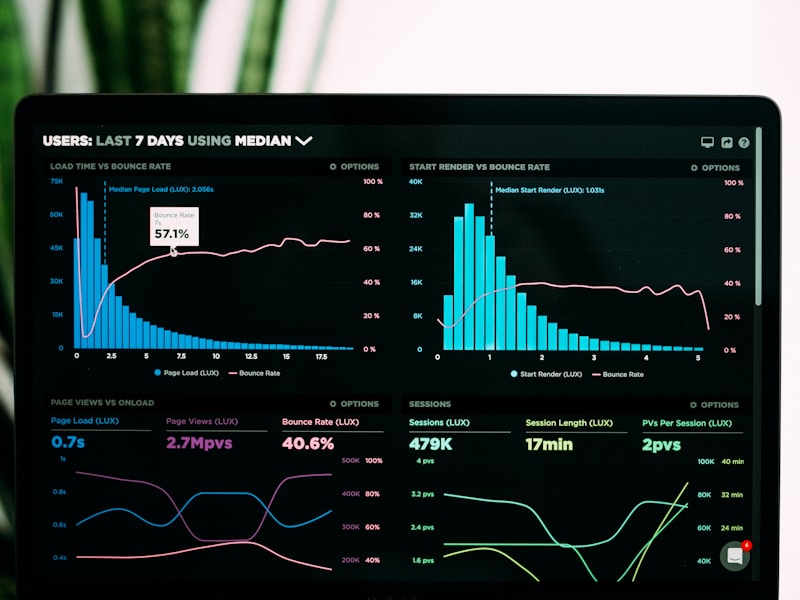
The word panel is used to describe two different things. Operations screens are the work areas where the team creates records, updates statuses and performs bulk actions. A reporting panel summarizes the results of that work: it presents indicators such as revenue, order count, returns and team performance in charts and tables. In most projects the two are parts of the same system, but their design priorities differ.
Moving from Excel spreadsheets to a panel
In many businesses, the first panel is an Excel file that several people update together. That file works up to a point; but as the number of records and the team grow, conflicts from simultaneous editing, deleted formulas and the question “which file is current?” begin. This is where admin panels come in: data is kept in one place, everyone sees the same current record and every change can be traced.
Who is it for?
- Businesses that take orders through several channels, such as the website, marketplaces, phone and dealers.
- Companies that want to follow the work of field, service or installation teams from a central point.
- Managers who work with more than one branch or warehouse and want to see the numbers in one place.
- Teams that manage customer applications, appointments or memberships with spreadsheets kept by hand.
- Projects that need a back-end admin screen for a website or a custom web application.
Operations screens in admin panel software
Admin panels deliver the most value as the screens your team keeps open all day. On these screens, the first measure is not visual appeal but how many clicks a task takes. Before we begin the design, we list the actions your team performs most often and try to make them possible in the fewest steps.
Customer, order and record screens
A customer card should show not only contact details but also past orders, open requests, notes and the conversations held. On the order screen, the status of the order, whether payment has been received, shipping information and the return process, if any, should be traceable in the same place. When designing admin panel software, we aim to show the whole story of each record on a single page.
Filters, search and saved views
In a list with thousands of records, the right filter is the most useful feature. Being able to combine filters such as date range, status, branch and responsible person, and being able to save frequently used filter combinations as saved views, speeds up the work. For example, the warehouse manager should be able to open just the orders “to ship today” with one click every morning.
Bulk actions and workflow states
Instead of changing the status of hundreds of orders one by one, you need to select them and update in bulk, print labels or assign them to a team member. We also define up front which states a record can go through and who can make each transition. That way, inconsistencies such as “an order shipped without being approved” are blocked by the system.
Screens built for daily use
On a screen used all day, small details make a big difference. Table columns that can be hidden and ordered per user, keyboard shortcuts for frequent actions, smart default values in forms and the ability to undo an action made by mistake are some of them. When designing admin panel software, we settle these details by trying them out with the people who will use the screen every day.
Alerts and task lists
A good panel does not only answer when asked; it points out situations that need attention. Products whose stock has fallen to a critical level, requests that have been waiting for a response for a certain time or invoices with overdue payments can show up as tasks on the relevant person’s screen. It is important to keep the number of these alerts balanced; a system that raises an alert for everything is soon ignored.
Role-based permissions and activity logs in admin panels
If the accounting, sales, warehouse and customer service teams all work in the same panel, letting everyone see everything creates both confusion and a security risk. In role-based permissions, instead of granting permission to users one by one, roles are defined and users are assigned to those roles. As admin panels grow, this structure keeps permission management simple.
How are roles defined?
We define roles starting not from the organization chart but from real jobs. For each role, we look for answers to these questions:
- Which menus and records can it see?
- Which records can it create, edit or delete?
- Does it see only the data of its own branch or of the records assigned to it?
- Can it see sensitive fields such as cost and profit margin?
- Can it export data?
The last question is especially important: exporting is the moment when data leaves the panel’s security boundaries. That is why we recommend giving bulk export permission only to the roles that really need it.
Activity history
Who changed an order’s amount, who deleted a customer record? Good admin panel software keeps the answers to these questions. We record critical actions with information on who changed which value to what, and when. This record makes it easier to find the source of mistakes and also brings transparency within the team.
Session and access security
Admin panels are the door to your business’s most sensitive data, so the login screen is part of the design too. Options such as two-step verification, closing the session after a long period of inactivity, limiting failed login attempts and, where needed, allowing access to the panel only from certain networks are assessed together according to the sensitivity of the data. Being able to shut off a departing employee’s access immediately is equally important.
Personal data and KVKK
Admin panels often contain personal data such as customer names, phone numbers and addresses. The Turkish Personal Data Protection Law No. 6698 (KVKK) requires the data controller to take appropriate technical and administrative measures to prevent unlawful access to personal data. Permission boundaries, activity logs and encrypted connections support the technical side of these measures. For the law and related regulations, you can consult the website of the Turkish Personal Data Protection Authority (KVKK).
How is a reporting panel designed?
A bad reporting panel is a screen that lines up many charts side by side and gives a clear answer to no question. A good panel helps a specific person make a specific decision. That is why we start the design not from charts but from questions: “Which branch is behind target this week?”, “Which products are returned most?”
Defining metrics together
The same word can mean different things to different teams. Is “sales” the amount at the time of the order, or the amount after returns are deducted? Is VAT (KDV) included? Are canceled orders counted? Before a reporting panel is built, we clarify the definition of each metric in writing. If this step is skipped, two managers look at the same panel and talk about different numbers.
Real-time or periodic?
Real-time reporting screens are screens where data appears in the panel the moment it is created, and they make operations tracking much easier. But not every report needs real-time data. Heavy calculations such as a monthly revenue comparison can be prepared in batches at set hours; this both speeds up the panel and does not strain the live system. We decide how often each indicator is updated according to the need.
Targets and comparisons
A single number often tells you nothing; is receiving a hundred orders this week good or bad? A reporting panel gives a number meaning when it shows it with context: the previous period, the same period last year or a target you set. Being able to enter targets through the panel makes it easier for management to redefine the numbers at the start of each period.
The right chart in the right place
- A line chart for change over time.
- A bar chart for comparing categories.
- A large number and its difference from the previous period for showing status against a single target.
- A link from the chart down to the related list of records for users who want detail.
- A map for branch or region distribution, but only if location really matters for the decision.
Pie charts and three-dimensional effects may look eye-catching, but they make comparing values harder. For admin panels, a simple visual language and consistent use of color let the screen be read in a few seconds.
Data export
A panel cannot answer every question; sometimes your team wants to look at the data in their own spreadsheets. Being able to export filtered lists in CSV or Excel format and to take periodic extracts for accounting or auditing meets this need. Preparing large exports in the background and notifying the user when they are ready keeps the panel from freezing.
Scheduled summaries
Not every manager wants to log in to the panel every day. Sending certain reports, such as a weekly revenue summary or an end-of-month operations report, regularly by email to selected people widens the reach of the reporting panel. Including only the main indicators in the summary email and adding a link to the panel for detail protects both readability and data security.
Speed as data grows
A reporting panel may run fast in the first months and slow down as the number of records grows. Suitable indexes for frequently used queries, pre-calculated summary tables and reading reports from a separate copy instead of the live database prevent this slowdown. Planning these decisions in the first version heads off major changes later.
A ready-made reporting tool or custom admin panel software?
Ready-made tools such as Power BI, Looker Studio or Metabase can be a fast, affordable start for businesses whose data sits in an orderly source. If what you really need is to interpret marketing and sales data, our data analysis and reporting service is a better starting point than developing software.
Custom admin panel software comes to the front in these cases:
- If you need not only to see reports in the panel but also to create and update records.
- If the data comes from more than one system and needs to be combined and cleaned first.
- If the permission rules are more detailed than what ready-made tools offer.
- If the panel is planned to be opened to customers or dealers as well.
- If the per-user license fee turns into a significant expense as the number of users grows.
In some cases the two approaches can be used together: operations screens are custom built, while management’s periodic analyses are done with a ready-made tool. What matters is that the tool fits the need, not that the need is forced to fit the tool.
Starting with a ready-made tool and moving to custom admin panel software as needs become clear is also a reasonable path. In that case, the metric definitions and data cleaning done in the first stage are not wasted; the custom panel is built on that foundation.
Panels opened to customers and dealers
Admin panels do not always serve only the internal team. Panels where dealers see their own orders and current accounts, or corporate customers see their own usage reports, are built on the same logic. In this case, permission boundaries matter even more: every external user should see only the data belonging to their own company, and internal notes and cost information should never be exposed to the outside under any condition.
The user experience is also different in panels opened to outsiders. While the internal team uses the system every day, a dealer or customer only logs in to the panel from time to time; so the screens need to be understandable without explanation, frequent actions need to sit on the home page and flows such as password reset need to work on their own.
How does a panel project proceed?
- Data inventory: we map which systems hold the data, in what format and which one is the primary source.
- User and role map: we determine who will use the panel and for which tasks.
- Metric dictionary: we put the definition of every indicator that will appear in the reports in writing.
- Screen design: we try out the operations and report screens on a prototype with users.
- Data connections: we set up the data flow with existing systems and, if needed, migrate historical data.
- Testing: we compare the numbers against existing sources and test permissions separately for each role.
- Launch and improvement: we improve the panel by looking at which screens are really used once use begins.
In the first version, we recommend starting with the few screens each team needs most. Once use begins, you can see which reports are actually opened, which filters are used and which tasks the team still does outside the panel; later screens are planned from that observation.
If the data comes from different systems, the connection layer makes up an important part of the project; we describe this in detail on our API and system integrations page.
What determines the scope
- The number of data sources and whether those sources offer an API.
- The detail of user roles and permission rules.
- The number of operations screens and the complexity of workflows.
- The number of reports, the need for real-time data and the amount of historical data.
- Whether the panel will be open only to the internal team or to customers and dealers too.
What to prepare
If you come to the first meeting about admin panels with the following, we can clarify the scope much faster:
- A list of the software and Excel files you use today.
- The teams that will use the panel and the tasks each team does most often.
- The questions management asks regularly and that you struggle to answer.
- If you have them, samples of the reports prepared today.
Common mistakes
- Skipping metric definitions: the same number is understood differently by different teams and trust in the panel declines.
- Putting everything on the home screen: on a crowded screen, important alerts get overlooked.
- Thinking about permissions afterward: permissions restricted after launch cause pushback in the team and can leave gaps open.
- Building a panel without fixing the source data: wrong data is still wrong, even when presented in attractive charts.
- Not asking the user: the report a manager wants and the screen the team needs are often different.
- Launching without verifying the numbers: a panel should not be considered reliable until it has been compared side by side with real data and existing reports.
Frequently asked questions
Can admin panels work together with our existing software?
Yes. If your existing systems offer an API, the data is pulled directly; if they do not, alternatives such as a database connection or regular file transfers are considered.
How often does the reporting panel update the data?
That depends on the indicator. For operations tracking, data can be reflected in real time; periodic reports that need heavy calculation can be prepared at set intervals.
Can the panel be used from a phone?
Yes. Panel screens are designed to be readable on phones and tablets; for screens that need heavy data entry, desktop use takes priority.
Can each user see only their own data?
Yes. With role-based permissions, users can be limited to the data of their own branch, region or the records assigned to them.
What is the difference between admin panel software and a ready-made BI tool?
Ready-made BI tools focus mainly on visualizing data. Admin panel software, besides showing reports, also takes on operational work such as creating and updating records and managing workflows.
How long does it take to prepare admin panels?
The time varies with the number of data sources, the number of screens and reports and the detail of permission rules. After the data inventory and user map are done, we share a timeline split into phases.
Let’s bring your data onto one screen
Telling us which data you keep where today and which questions you cannot get quick answers to is enough for the first meeting. We will talk openly and together about which screens to start with for admin panels and which can wait. You can reach us through our contact page.
Other services in this section
-
 Custom Web Applications
We develop secure, fast and scalable web applications built for your business processes.
-
Mobile App Development
We design and build user-friendly mobile apps for iOS and Android that match your brand's voice.
-
API and System Integrations
We connect the software you use to each other and make your data flow automatic and error-free.