Analytics and Reporting
We measure your social media performance so you get more efficient results. With regular analytics and reporting, we keep improving your content strategy.
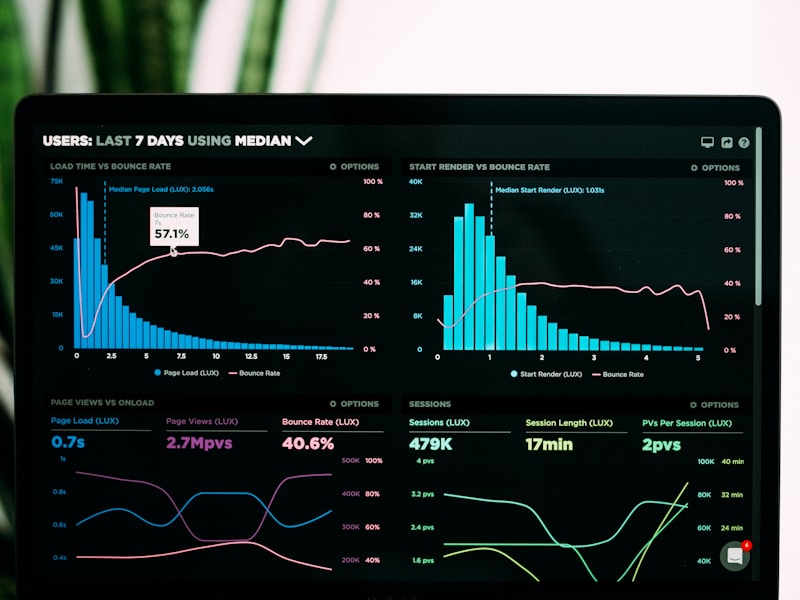
What we offer
- Monthly performance report
- Engagement analysis
- Strategy optimization
What is analytics and reporting for on social media?
Social media analytics and reporting means measuring what your work delivers and choosing the next step based on data. Platforms produce a large number of figures every day. A statistics screen read without separating the ones that relate to your goals confuses more than it guides. We filter the data against your goals, interpret it and turn it into a clear report.
Social media reporting is the last link in the cycle and also the input for its first link. Goals, audience and channel decisions are made during strategy development; the reports show which of those decisions held up and which need to be updated.
What this page covers
The social media reporting described here focuses on the performance of your organic accounts: posts, profile, community and audience. Cross-channel work that evaluates website, ad and sales data together is covered in our marketing data analysis service. Reports on ad campaigns are part of ad management.
The difference between social media reporting and an ad report
Ad reports measure what the budget you spent returned, using data such as clicks, conversions and cost. Social media reporting focuses on how organic content connects with the audience, how the profile is developing and how the community reacts. The two reports complement each other: topics that do well in organic content can be tested in ads, and the way a new audience from ads responds to organic content can be tracked separately.
The difference between a report and an analysis
A report tells you what happened; an analysis tells you why. “Reach dropped this month” is a report sentence. “Reach dropped because we published fewer videos and the share of content reaching new people got smaller” is an analysis. A good analytics and reporting service gives you both and ends with a recommendation.
Who is analytics and reporting for?
- Businesses that put regular effort and budget into social media but cannot see what it returns.
- Brands that manage their accounts with their own team and want an impartial outside assessment.
- Marketing managers who need to present regular results to management or partners.
- Companies that are active on several platforms and want to decide which channel to prioritize.
Which metrics do we look at?
In analytics and reporting, the choice of metrics depends on the goal. An account aiming for awareness and an account expecting messages and quote requests are not judged by the same numbers. Still, most social media reporting draws on the metric groups below.
Reach and impressions
Reach is the number of unique accounts that saw your content; impressions is the total number of times the content appeared on a screen. The share of content that reaches accounts that do not follow you shows whether the account is opening up to new audiences. Platforms change their metric names and calculation methods from time to time, so we note those changes in the social media report when periods are compared.
Engagement metrics
- Likes: The easiest reaction to give; on its own, a weak signal.
- Comments: They show that the content started a conversation; what they say matters as much as how many there are.
- Saves: A sign that the content was useful enough to come back to.
- Shares: A sign that the content was valuable or interesting enough to recommend to others.
How is the engagement rate calculated?
The engagement rate is found by dividing total engagement by a base number; follower count, reach or impressions can serve as the base. Because different tools use different formulas, you need to make sure the same method was used before comparing the rates in two reports. In social media reporting, we state which formula we use in every report.
Video metrics
For videos, watch time and, to the extent the platform provides it, the point where viewers drop off teach more than the view count. If many viewers leave in the first seconds, the problem is usually the opening; if viewers stay to the end but do not engage, the call to action may be weak. This distinction directly shapes how the next video is produced.
Story metrics
In Stories, forward and backward taps, exits and replies show the frame where a series loses attention. If exits in a Story series are concentrated at one frame, that frame is either unnecessarily long or irrelevant. Poll and question box responses are a practical way to learn the audience’s opinion directly.
Profile, traffic and inquiry metrics
Profile visits, link clicks, use of the contact button and the number of incoming messages are the organic indicators closest to social media’s business results. To measure traffic to your website accurately, we add UTM parameters to links and track these visits as a separate source in your web analytics tool. Follower growth and loss is a complementary figure that shows the overall health of the picture.
Message and comment data
The number of incoming messages and their topic distribution show the role of social media in customer communication. If price questions are increasing, interest is high but the profile may be missing information; if complaints are increasing, the problem may lie in the service rather than the content. This data comes from the records kept on the community side and is added to the audience section of the report.
Follower quality
A rising follower count is not necessarily good news on its own. Followers from countries outside your target audience, from unrelated accounts or from giveaway campaigns can hurt the engagement rate and the audience data. In social media reporting, we evaluate follower growth together with its source and how well it fits your audience.
Audience data
To the extent platforms provide it, followers’ age range, gender distribution, cities and the hours they are active on the account make up the audience section of the report. We compare this data with the audience targeted during the strategy phase. The gap between the targeted audience and the audience actually reached is an important sign that content and channel decisions need another look.
Data sources
The core data comes from the platforms’ own statistics screens: Meta Business Suite and professional account insights for Instagram and Facebook, page analytics for LinkedIn, and the app’s analytics section for TikTok. To access insights on Instagram, the account must be switched to a professional account; details are in the Instagram Help Center. For effects on the website side, we use web analytics tools such as Google Analytics.
Engagement analysis: the content behind the numbers
Total figures show the general direction of the account, while content-level analysis shows the reason behind that direction. In this part of the analytics and reporting process, we examine posts by grouping them on shared traits rather than one by one. That takes us from the observation “this post did well” to the conclusion “this type of content works with our audience.”
Reading content by group
- By pillar: Among expertise, product, behind-the-scenes and customer content, which is saved or shared more?
- By format: How does the performance of video, carousel and single-image posts differ for the same goal?
- By opening type: Of the content that starts with a question, a result or a mistake, which is watched longer?
- By time: Does the day and time of publishing have a noticeable effect on results?
The best and the weakest content
Every month we also look separately at the few pieces of content that performed best and worst. What successful content has in common points to a pattern that can be repeated, while weak content shows which topic, format or approach does not resonate with the audience. A weak piece is not always a bad piece; sometimes it was only published at the wrong time or in the wrong format.
Qualitative analysis of comments
Numbers tell you how much engagement there was, and comments tell you what that engagement means. We review comments and messages by topic and sentiment and summarize what the audience asks about most, what it praises and what it objects to. These findings combine with the observations collected on the community management side and turn into new content ideas.
Comparison with competitors
Competitors’ internal data is not accessible, but the posting frequency, format choices, comment counts and follower changes visible from the outside allow a general comparison. We use this comparison not to set targets but to see general trends and gaps in the industry. Comparing accounts of different sizes directly can be misleading, so we keep that difference in mind in our interpretations.
What does the monthly performance report include?
A monthly report should be structured so that a busy manager can read it in a short time and make a decision. Instead of long tables and dozens of charts, we build a layout that brings the important points forward and keeps the detail in the background. In social media reporting, we usually work with these sections:
- Summary: The month’s most important findings and recommendations for the next month.
- Goal indicators: The metrics chosen in the strategy phase, compared with the previous period.
- Content performance: The best and weakest content, with the reasons.
- Audience and community: Follower change, audience characteristics, and the comment and message topics that stood out.
- Channels: If several platforms are managed, an assessment of each channel against its own role.
- Action list: What to increase, what to stop and what to try next month.
Who will read the report?
The same data should be presented differently depending on who reads it. A few core indicators and clear recommendations are enough for a business owner, while a marketing team also needs content-level detail. When planning analytics and reporting, we settle early on who will hold the report and which decision it will be used for.
Visualization
Charts make numbers easier to understand, but a wrongly chosen chart can also mislead. We prefer to show change over time with a line chart and the difference between content types with a bar chart. A one-sentence comment under each chart makes clear, in social media reporting, what the reader should take from it.
Choosing the comparison period
Comparing a month only with the month before can be misleading for seasonal businesses. In sectors such as tourism, education or retail, comparing with the same period last year gives a more meaningful result. We also mark campaign periods and special days separately in social media reporting, so that an unusual rise or drop is not mistaken for a lasting trend.
Setting a starting point
When we begin an analytics and reporting engagement, we first record the current situation: the recent period’s average reach, engagement, message count and follower change. Later reports are interpreted against this starting point. Comparing the account with its own history rather than with industry averages gives a fairer and more workable assessment.
The report meeting
Instead of only sending the report, we recommend going through it in a short review meeting whenever possible. You know best how the numbers line up with what actually happened in the business: the phone calls that month, store traffic or the questions customers asked all complete the report. Such a meeting turns the analytics and reporting process from one-way information into a shared assessment.
From data to decisions: strategy optimization
The real value of analytics and reporting shows when it is reflected in next month’s plan. The recommendations at the end of the report are carried into the new content calendar, the production priorities and, where needed, the strategy. As the cycle repeats every month, tested findings replace assumptions.
Example: from finding to action
Say the report shows that carousel guide posts are saved noticeably more than other formats but do not bring profile visits. At this point analytics and reporting produces two recommendations: increase the number of guide posts, and add a clear call to action on the last card that sends people to the service page on the profile. In the next report, the effect of this change on profile visits is tracked separately.
Small, controlled tests
When we want to change something, we test a single variable instead of changing everything at once: the opening line, the video length, the cover design or the publishing time. We run the test over several pieces of content and compare the results with the previous period. Because organic social media is not a controlled experiment environment, we read the results as a strong signal, not as conclusive proof.
Quarterly and annual reviews
Monthly reports suit short-term adjustments, but some trends only become visible over a longer period. In quarterly and annual reviews, we look at the overall picture of content pillars, channels and goals and talk with you about what should change in the next period.
When does the strategy change?
One month of weak results is not enough to change a strategy; fluctuations are part of the nature of social media. But if a trend moves in the same direction for several periods and shows that the targeted audience is not being reached, or that the chosen channel is not doing its expected job, we revisit the strategy.
Transparency in reporting
In the report, we show not only the numbers that went well but also the drops and the tests that did not work. Writing out the reason for weak results plainly is necessary for choosing the right next step. Analytics and reporting becomes a reliable decision tool only when the full picture is visible.
The limits of data
Platform data is valuable but not perfect. Numbers can be updated later, some metrics are calculated as estimates, and statistics screens do not always show historical data for an unlimited time. For this reason, in social media reporting we save the data at regular intervals and make long-term comparisons from those records.
Common mistakes in analytics and reporting
- Focusing on vanity metrics: Likes and follower counts alone do not describe the value that comes back to the business.
- Giving numbers without context: A number with no comparison period or goal does not say whether it is good or bad.
- Trusting the average: A single very successful piece of content can lift the month’s average and hide the weakness of the others.
- Mistaking coincidence for cause: Two developments in the same week may not be a result of each other.
- Not tying the report to a decision: A report that is read and put aside wastes the effort spent preparing it.
- Purchased followers: Fake accounts lower the engagement rate and distort the audience data.
The access and information needed for analytics and reporting
- The permissions needed to access the accounts’ insights.
- View access to your website analytics, if you have them.
- Business data you want to share, such as sales, reservation or quote counts.
- Information about campaigns, price changes and operational developments during the period.
Frequently asked questions
How often is social media reporting done?
We do the core reporting monthly. Interim reviews can be added during campaign periods or for busy accounts; quarterly and annual reviews help you see long-term trends.
Which metric is the most important?
In social media reporting there is no single most important metric; what matters are the metrics tied to your goal. Reach is more meaningful for awareness, messages and link clicks for inquiries, and saves and shares for the value of the content.
Can the effect of social media on sales be measured?
Partly. Tracking parameters added to links, message records and campaign codes help follow this effect, but it is not possible to measure every customer who sees you on social media and later buys through another channel.
Which tools are used for social media reporting?
Core data is taken from the platforms’ own tools, such as Meta Business Suite, LinkedIn page analytics and TikTok analytics. To see the effect on the website, we use web analytics tools such as Google Analytics.
Can we see competitors’ data?
Competitors’ statistics screens cannot be accessed. A general comparison can be made using open data such as posting frequency, format choices, comment counts and follower changes.
Can I get the analytics and reporting service on its own?
Yes. Regular analytics and reporting support can be provided for businesses that manage their accounts with their own team. In this model, the reports are prepared together with recommendations your team can apply the following month.
Let’s read your data together
Seeing where your accounts stand today is the first step toward setting the right goals. Share your account connections and what you expect from social media; we will interpret your current data together and talk through a reporting setup that suits you. You can tell us about your reporting needs through our contact page.
Other services in this section
-
 Strategy Development
We develop content and advertising strategies suited to your brand's target audience, giving you planned and effective social media management.
-
Content Planning
The monthly content calendar lets us manage your brand's social media posts in an orderly, strategic way. That way, you can reach…
-
Content Creation
We prepare professional graphic designs, video productions and creative copy that fit your brand's identity, catch attention and drive engagement.